3D Transformative Digest | Designs by Modish

Prologue: One Row
The row I return to describes a five-story apartment block in a regional city. It gives a location, a structural system, a floor count, a damage grade, and a replacement cost per square meter. Someone graded that building twice. The first time from a satellite image, looking down at a roof that had lost its outline. The second time from the pavement, with a crack gauge and a camera that stamped every photograph with its coordinates. The two grades agreed. The row was closed.
At the end of the row sits a figure in dollars. It is modest. For the families who once climbed those stairs, it is also the entire building, reduced to the one form in which a lender can recognize it.
Multiply that row across a country and you reach the number on this cover. The fifth Rapid Damage and Needs Assessment for Ukraine, known in my trade as RDNA5 and prepared jointly by the World Bank, the European Union, the United Nations, and the Government of Ukraine, puts the cost of recovery and reconstruction at nearly $588 billion over the next decade. That is close to three times the size of the country's entire annual economy.
Most readers take that figure as a verdict. I read it as a document, and documents can be audited.
I. Damage, Needs, and the Distance Between Them
The first distinction anyone learns in this work is also the one headlines most often blur. Damage and needs are separate quantities, calculated separately, and they answer different questions.
Damage is the replacement value of physical assets destroyed or broken: roofs, rail bridges, transformer stations, grain terminals, the gymnasium of a secondary school. RDNA5 puts direct physical damage in Ukraine at more than $195 billion, up from $176 billion in the assessment a year earlier. Needs are larger. They carry the cost of rebuilding to a better standard than what was lost, of clearing what must be cleared before anything is built, of restoring services and incomes while the economy limps along. Damage looks backward. Needs look forward, and needs are what a government asks the world to fund.
The sector table reads like the index of a modern state. Transport, more than $96 billion. Energy, $91 billion. Housing, $90 billion. Commerce and industry, $63 billion. Agriculture, $55 billion. Explosive hazard management and debris clearance, $28 billion.
I always stop at that last line. Twenty-eight billion dollars spent on subtraction: finding what is buried in fields, hauling away what used to be walls. None of it produces a single new room, and all of it has to happen first.
Housing is where the table stops being abstract. More than 2.5 million homes, about 13 percent of the national housing stock, are damaged or destroyed. More than three million households are affected, and more than 250,000 residential buildings are damaged. Damage to homes alone is estimated at $65.9 billion. Roughly one dwelling in every eight, from the capital to the smallest village, each with its own row.

II. How a Country Is Measured
The procedure has three layers, and a skeptic should care about every one.
First comes imagery. Satellite and aerial pictures of the present are laid against pictures of the past, and every structure that has changed is flagged and graded. Then verification. Engineers on the ground sample what the imagery claimed, correct it where the view from above was wrong, and record what no camera overhead can see: a slab that has deflected, a stair core that has sheared from its landings. Last, costing. Unit rates are applied to each damaged asset according to its type, its size, and the severity of its grade, and the results roll up by sector until they become a national figure.
Journalists ask about the first layer. Finance ministries fight about the third. I have spent more hours arguing over the price of rebuilding a square meter of mid-rise housing in a city where cement has become scarce than over any satellite image, because a small error in a unit rate, repeated across a quarter of a million residential buildings, moves the headline by billions.
Here I part company with a common assumption. Advocates tend to believe that a larger number helps the cause, that the more alarming the bill, the more money will follow. My experience says the reverse. Donors and lenders discount what they cannot trace. An assessment that lets an auditor walk from the headline down through the sector, the region, the town, and finally to the individual row tends to be funded close to its face value. An assessment that cannot be traced gets a haircut, then a second haircut at the next negotiation, and the country spends a year defending its arithmetic when it should be pouring foundations.
Revision is part of the method. The rise from $176 billion to more than $195 billion in direct damage reflects a conflict that kept adding rows. Sometimes the ledger moves the other way. Early estimates put the land potentially contaminated by mines and explosive remnants at about 174,000 square kilometers, roughly the size of Florida. As survey technology improved, the figure fell to about 139,000, still more than 20 percent of the country. More than 40,700 square kilometers have since been returned to safe use through humanitarian demining.
The gap between those first two figures was closed by better measurement, without a single detector sweeping a single field.
I find that one of the most instructive facts in the entire assessment. Land presumed dangerous goes unfarmed and unbuilt. Every square kilometer that a sharper survey removes from the hazard map returns to the economy before anyone has spent a cent on clearance. Precision, in my field, has a cash value.
The Government's immediate recovery priorities total more than $15 billion, directed at destroyed housing, demining, and economic support. Call it the first installment against the ledger. Every later installment will be argued from the same document.
III. The Same Method at Another Scale
The final Rapid Damage and Needs Assessment for Gaza, prepared by the European Union, the United Nations, and the World Bank, arrives at $71.4 billion in recovery and reconstruction needs over the next decade. Physical damage accounts for $35.2 billion. Economic and social losses add $22.7 billion.
A smaller headline. A far denser ledger.
The housing figure makes the density legible: more than 371,888 housing units destroyed or damaged, packed into a compact coastal territory. More than half of hospitals are non-functional. Nearly all schools are damaged or destroyed. When the civic buildings of a place fail together, the needs figure must carry the cost of recreating an entire urban system at once, and the order of that work becomes a question of sequence as much as of money.
The assessment's own schedule shows the pressure. It calls for $26.3 billion in the first eighteen months, more than a third of the decade's total compressed into its opening stretch. Front-loaded needs are the hardest to finance, because the money has to be committed before there has been time to watch it work.
That is where method earns its keep. The Gaza assessment combined remote sensing with ground-verified data: satellite imagery checked against the work of Gaza-based engineers and cost assessors who knew the local building types and the local prices, and who knew how local concrete frames tend to fail. The particulars differ from those used in Ukraine. The logic is identical. See from above, confirm from below, price every row, and publish the sum in a form that can be taken apart again.
The consistency strikes me as quietly remarkable. Two very different places, two very different scales, and one discipline of evidence applied to both. The world now rebuilds by evidence rather than memory, and the difference shows up in who gets paid, and when.
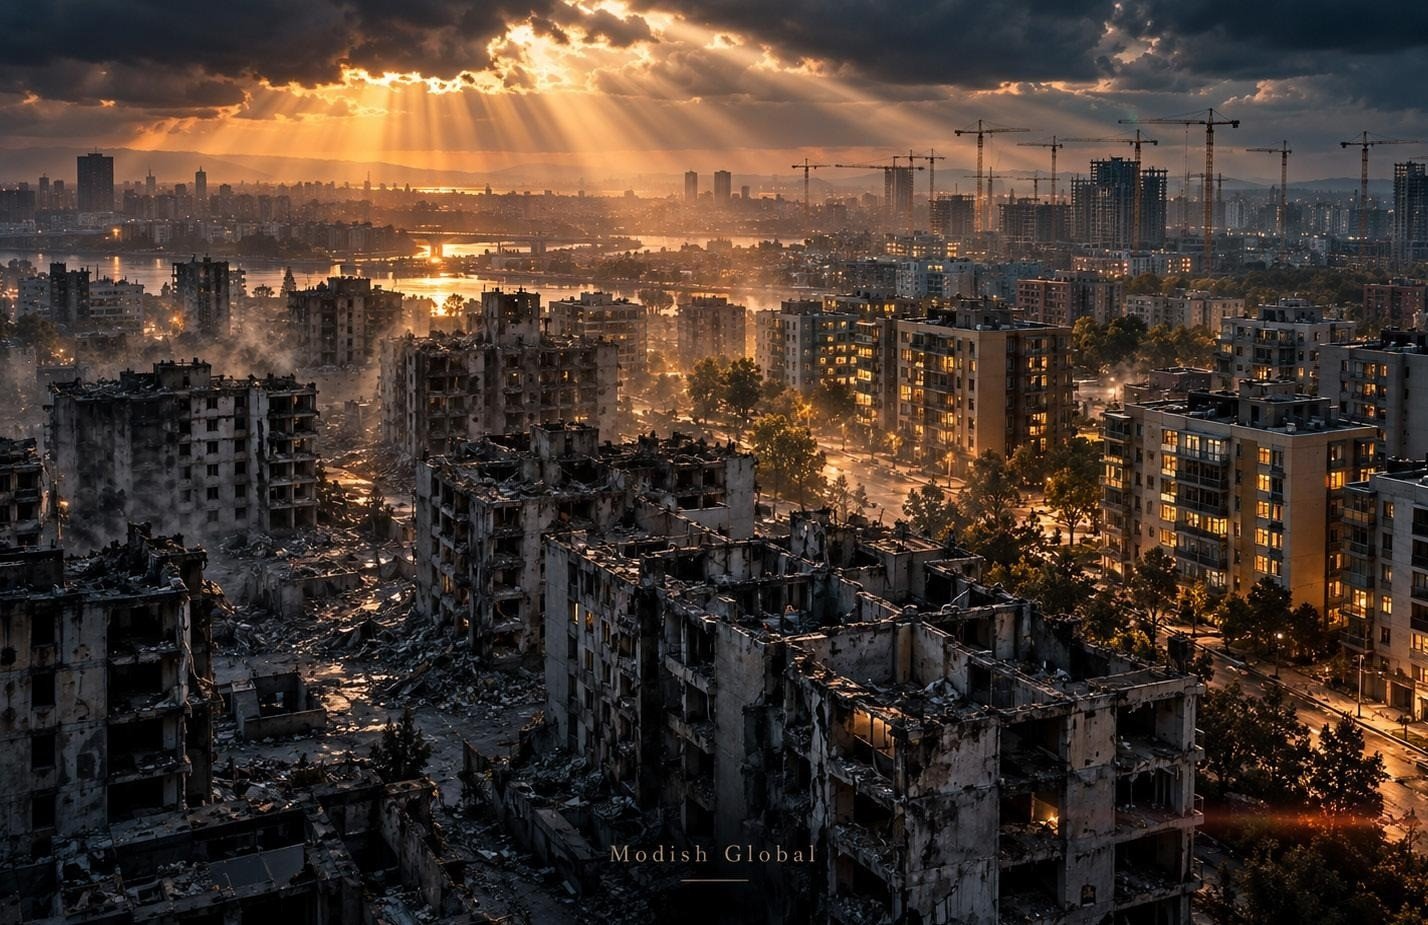
IV. What Survives the Building
In one municipal archive I visited, the building permits for an entire district sat in grey cardboard boxes on steel shelving. Each folder held floor plans and structural calculations, sometimes the name of the contractor who poured the slabs. The district itself had been badly damaged. The boxes had come through untouched.
That town settled its housing claims faster than any other in the region. A neighboring town, whose archive had been lost, spent years in disputes over what had stood on which parcel, how many floors it had, whether the ground floor had been a shop or a flat. Each disagreement was reasonable. Each one was expensive. With nothing on paper, every claim had to be negotiated from recollection, and recollection is generous to itself.
I have watched versions of this play out on more than one continent, and the pattern holds. When a building is destroyed, the only thing that survives it is its record: the documented account of what it was and what happened to it. Where that record is thorough, a damage assessment becomes a matter of comparison. Where it is thin, the assessment becomes a matter of testimony, and testimony invites dispute. Societies that kept good records rebuild faster and quarrel less over what they are owed, because the question of what existed has already been answered.
The practice is changing. Aerial capture has made continuous documentation possible at the scale of whole regions, so a city's condition can sit on file long before anything threatens it.
That shift moves the economics of recovery in a direction I welcome. Strip a damage assessment to its bones and it is a subtraction: the value of what stood, minus the value of what remains. For most of history the first term had to be reconstructed from fragments and good faith. Increasingly it can be looked up.
Cartographers used to draw a place to show what it was. The cartography of ruin draws a place to show what it was precisely enough to build it again. Across one country, that precision carries a price of $588 billion. The rows underneath are where the buildings are still standing.
Leave a Reply